
High Altitude Balloon Flight Predictor
As part of a rocket project during my MEng Aerospace Engineering course (which won the UKSEDS National Rocketry Championship), I developed a tool to predict the flight path of a high altitude balloon throughout its ascent up to burst, followed by the descent of a payload on a parachute.
The tool was not completly finished, although the majority of the method closely follows the results achieved through alternative prediction methods. Currently the entire calculation is done using MATLAB, though a Python version may be created to better integrate with the flight control systems onboard the rocket.
Overview of method
The calculation is split into separate horizontal and vertical components. Firstly, a vertical ascent (and descent) prediction is calculated using a method similar to that created by Steve Randall. Weather data is then used to predict the horizonal motion of the balloon during the ascent & descent.
Vertical Prediction
Firstly, the lift force is calculated using the known payload mass, balloon volume and densities of the air and lifting gas. The drag acting on the balloon is taken from the cross sectional area of the balloon at launch with an assumed drag co-efficient of 0.3. The initial ascent rate is calculated from the initial lift and drag, and is assumed to be costant throughout the flight. The descent rate is found from the drag co-efficient of the parachute, and also assumed to be constant. These assumptions are consistent with other methods (such as the CUSF predictor), but this is definitely place where the accuracy of the model could be improved.
Horizontal Prediction
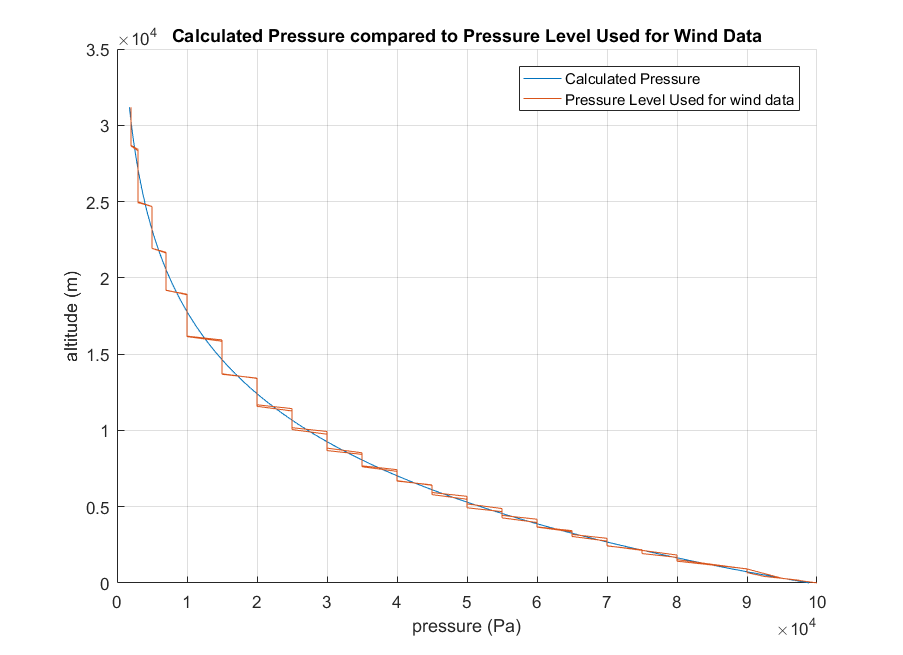
Wind velocity components from the Global Forcast System (GFS) are used to determine the direction and distance the balloon will travel horizontally. GFS data is split into vertical levels which are mostly defined by pressure, not height. This means a conversion must be made to find which data level to use. A pressure decay rate from the surface to a given height, such as the tropopause, can be calculated as a conversion (using the same GFS weather data).
Once the desired pressure level has been found, the wind velocity components can be used to caclulate the distance travelled by the balloon over a specified time, as well as its bearing. The bearing and distance allow a new co-ordinate to be found and used as the next step of the iterative calculation.
The current calculation uses the GFS data with a 1° latitude/longitude grid scale. Data is also available at a resolution of 0.25°, which would increase accuracy. This higher resolution does however increase the size of the GFS data file from around 20mb to 200mb, and some changes to the calculation would need to be made to account for the different array sizes.
Prediction output
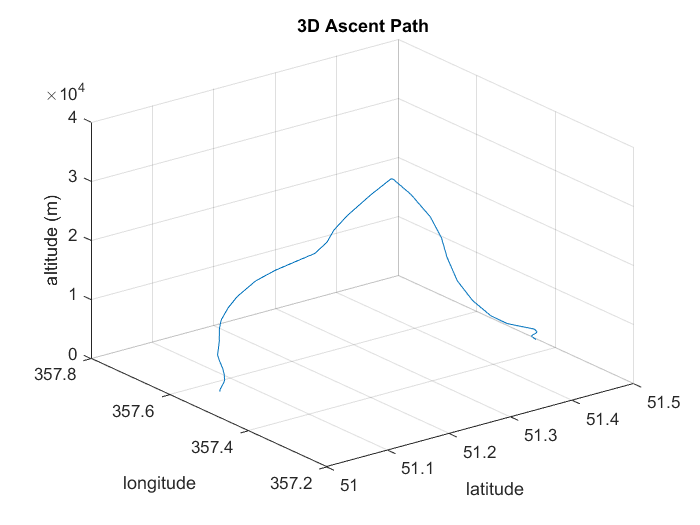
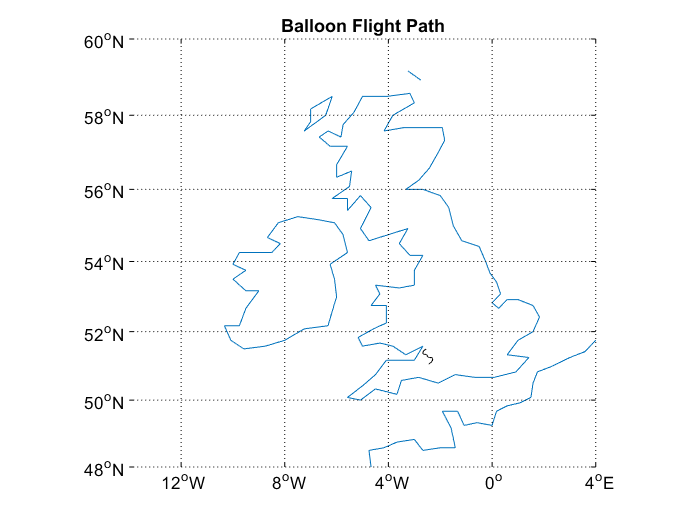
An array containing longitudes, latitudes, pressures and wind velocity components is updated after every iteration. This allows results to be plotted within MATLAB or exported for analysis elsewhere.
The current prediction produces almost identical results to other methods such as the CUSF and ASTRA tools in the vertical axis, but there are slight differences in the horizontal path. I do plan on trying the increased resoltion GFS data to see what effect that has on the results.
this post is incomplete, more details on the calculation steps and fancy pictures will be added….maybe